Good inventory management for a small business comes down to four habits: classify items by value so you focus on the few that matter most (ABC analysis), set a reorder point with safety stock for each important item, issue stock in the right order (FIFO, or FEFO for anything that expires), and count a little every week instead of a lot once a year. Track inventory turnover and days of inventory to see whether cash is tied up on your shelves.
None of this needs expensive software to start. It does need consistent item codes and honest records. Below we cover each method with simple examples, the tools that support them, how to handle multiple locations and dead stock, and the mistakes that most often throw stock figures off.
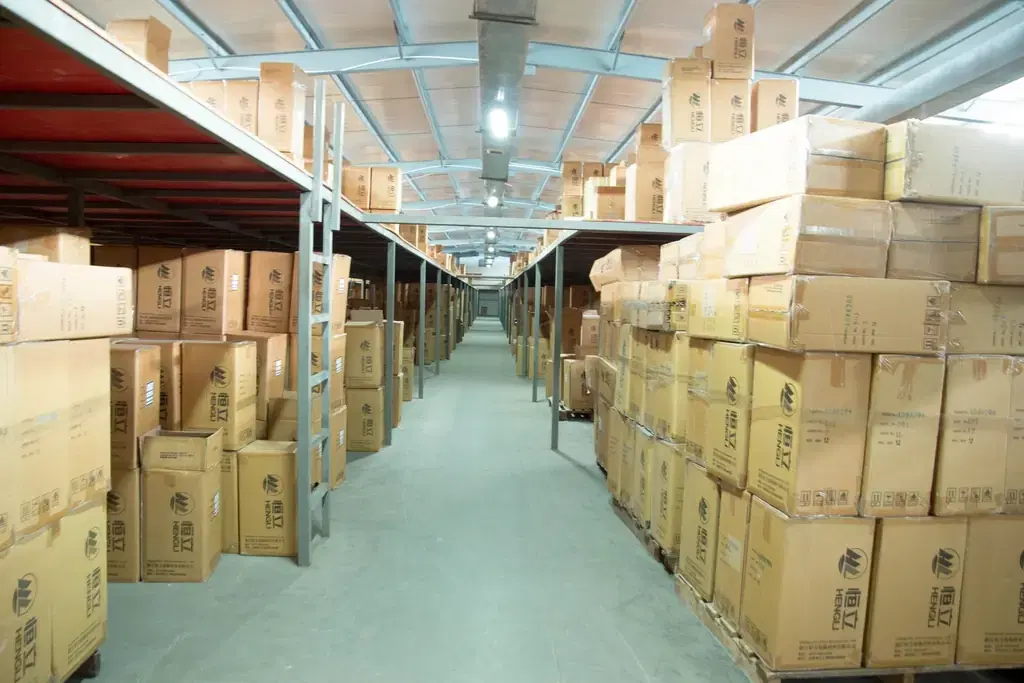
ABC analysis of inventory: decide where attention goes
Not every item deserves the same care. ABC analysis ranks items by annual consumption value (units used or sold per year multiplied by unit cost). In most businesses a small share of items accounts for most of the value, a pattern often described as the Pareto principle. Those are your A items, and they deserve tight control.
To do it, export a year of sales or usage, multiply by cost, sort from highest to lowest and calculate the cumulative percentage. The cut-offs below are common rules of thumb, not fixed laws; adjust them to your business. Revisit the classification every quarter or two, because seasonal and new items move between classes.
| Class | Typical share of items | Typical share of value | How to manage |
|---|---|---|---|
| A | About 10–20% | About 70–80% | Weekly review, tight reorder points, frequent counts |
| B | About 30% | About 15–25% | Monthly review, standard reorder rules |
| C | About 50–60% | About 5–10% | Simple rules, bulk ordering, occasional counts |
Reorder points and safety stock, with a worked example
A reorder point tells you when to place an order so new stock arrives before you run out. The basic formula is: reorder point = average daily usage × lead time in days + safety stock. Safety stock is the buffer that protects you when demand spikes or the supplier is late.
A simple way to size safety stock is: (maximum daily usage × maximum lead time) − (average daily usage × average lead time). Say you sell an average of 20 units a day, and on busy days up to 26. Your supplier usually delivers in 7 days, but sometimes takes 9. Average demand over the lead time is 20 × 7 = 140 units. The worst case is 26 × 9 = 234 units. Safety stock is 234 − 140 = 94 units, and the reorder point is 140 + 94 = 234 units.
So when stock falls to 234, you order. This method is easy to explain and fairly conservative. Businesses with good sales history often move to a statistical method that uses the standard deviation of demand and a target service level, which usually gives a smaller buffer for steady items and a larger one for erratic ones.
Remember that safety stock costs money. Every unit sitting as a buffer ties up cash, takes shelf space and risks damage or obsolescence. It is normal to hold generous safety stock on fast-moving A items where a stock-out loses sales and customers, and very little on slow C items where a short wait does little harm. The right buffer is a business decision about service level, not just a formula.
- Use recent data, such as the last 8–12 weeks, and adjust for known seasons and festivals.
- Measure lead time from placing the order to stock being ready to sell, not just delivery.
- Set reorder points for A and B items first; C items can use simpler min–max rules.
- Review the numbers whenever a supplier or demand pattern changes noticeably.
FIFO and FEFO: issue stock in the right order
First in, first out (FIFO) means you sell or use the oldest stock first. It reduces the risk of items becoming obsolete, faded, out of fashion or damaged in storage. For anything with an expiry date, such as food, medicines, cosmetics, adhesives or chemicals, first expired, first out (FEFO) is better: you pick by expiry date, because a newer batch can sometimes expire sooner.
The method only works if the physical layout supports it. Load new stock behind or below the old, label batches and expiry dates clearly, and make the picking location of the oldest batch obvious. Software can tell staff which batch to pick, but only if batch numbers and expiry dates are recorded at receiving.
Cycle counts instead of one painful annual stocktake
A full annual stocktake closes the business for a day or more, and by the time differences are found, nobody remembers why they happened. Cycle counting spreads the work out: you count a small set of items every day or week so that every item is counted several times a year, with A items counted most often.
When a count differs from the system, investigate before adjusting. Common causes are receiving errors, sales billed under the wrong item, unrecorded damage and returns put back without an entry. Fixing the cause matters more than correcting the number. Keep a simple log of adjustments with a reason code, and patterns appear quickly: one supplier short-shipping, one counter billing the wrong variant, or one shelf where breakage goes unrecorded.
- A items: count monthly or even weekly.
- B items: count quarterly.
- C items: count once or twice a year.
- Count when stock is not moving, such as before opening, and freeze transactions for that item during the count.
- Track count accuracy as a percentage over time; it tells you whether your processes are improving.
Barcodes and item codes
Most stock errors are typing errors. Barcodes remove much of that risk at receiving, billing and counting. Many products already carry a manufacturer barcode; for your own items, loose goods or internal locations, you can print labels in a format such as Code 128 or QR from inventory software and an inexpensive label printer.
If you sell your own branded products through retailers or marketplaces, you will usually need registered GTIN barcodes (the EAN-13 numbers on retail packaging), which in India are issued through GS1 India. Whatever system you use, the rule is one item, one code, and every code must exist in your item master before the goods reach the shelf. Sizes and colours of the same product need separate codes, or you will never know which variant is actually selling.
Excel or inventory management software for small business?
Excel is a perfectly good starting point for a business with a few hundred items, one location and one or two people updating it. It breaks down when several people edit at once, when you need batch or expiry tracking, or when billing and stock live in separate places and have to be reconciled by hand.
The signal to move is usually one of these: stock figures nobody trusts, frequent stock-outs of fast movers, more than one location, or hours spent each week reconciling sales against stock. Choose software that links purchasing, billing and stock in one place, supports barcodes, and produces the reports described in the metrics section below.
When you do switch, do not import years of messy history. Clean the item master first, merging duplicates and fixing names, units and codes. Then do a full physical count and load those quantities as your opening stock on a fixed cut-over date. Run the old sheet and the new system side by side for a week or two, then stop using the sheet. Starting clean is far easier than cleaning up inside a new system.
| Need | Excel | Inventory software |
|---|---|---|
| Under ~300 items, one location | Works well | Optional |
| Several people updating | Version conflicts and overwrites | User roles and audit trail |
| Barcode billing and receiving | Awkward | Built in |
| Batches and expiry dates | Manual and error-prone | FEFO picking and expiry alerts |
| Multiple shops or warehouses | Very hard to keep accurate | Transfers and per-location stock |
| Reorder alerts | Formulas you must maintain | Automatic, per item |
Managing stock across multiple locations
With a second shop, warehouse or godown, the most common problem is stock that exists on paper in one place and physically in another. Every movement between locations should be a recorded transfer with a sender and receiver, not a quiet adjustment. Items in transit should show as in transit, not vanish from one location and appear in the other.
Set reorder points per location, because demand differs. Before buying more, check whether another location is overstocked. A weekly review of slow items at each location, followed by a transfer to where they sell, often clears stock faster than a discount. Where possible, keep one location, usually the main warehouse or godown, as the buying point, so purchase orders are not raised independently by each shop for the same supplier.
Dead stock and the metrics that reveal it
Dead stock is inventory that has not sold for a long period, often defined as six to twelve months depending on the business. It ties up cash and space and usually loses value. Run an ageing report regularly, act on items early with bundles, returns to suppliers where agreements allow, or markdowns, and stop reordering them.
Two metrics tell you how hard your inventory is working. The inventory turnover ratio formula is cost of goods sold divided by average inventory at cost, where average inventory is usually (opening stock + closing stock) ÷ 2. Days of inventory on hand is 365 divided by turnover. For example, with annual cost of goods sold of ₹60 lakh and average inventory of ₹10 lakh, turnover is 6 and days of inventory is about 61. Compare yourself with your own history and similar businesses rather than a universal target.
- Stock-out rate on A items: how often a fast mover was unavailable.
- Count accuracy: the share of counted items that matched the system.
- Ageing: value of stock older than 90, 180 and 365 days.
- Gross margin return on inventory: gross margin divided by average inventory cost.
Common mistakes and a note from RED SAG
The mistakes we see most often are simple: duplicate item names for the same product, goods sold before they are received in the system, returns and damages never recorded, reorder points set once and never reviewed, and buying in bulk for a discount that the carrying cost quietly cancels out. Fixing these habits improves accuracy more than any new tool.
RED SAG, a small software company in Tiruppur, builds inventory and billing software for small businesses. If you are outgrowing Excel, we are happy to look at your current process and suggest whether an off-the-shelf tool or something tailored makes more sense. For many small shops, a well-configured ready-made system is enough, and we will say so.
Frequently asked questions
How do I calculate a reorder point?
Multiply average daily usage by the supplier lead time in days, then add safety stock. For example, if you sell 20 units a day, the lead time is 7 days and safety stock is 94 units, the reorder point is 140 + 94 = 234. When stock falls to that level, place a new order.
What is a simple safety stock formula?
A common simple method is maximum daily usage multiplied by maximum lead time, minus average daily usage multiplied by average lead time. It is easy to calculate from sales records and tends to be conservative. With good sales history, a statistical method based on demand variability and target service level usually gives a better-sized buffer.
What is the difference between FIFO and FEFO?
FIFO issues the oldest stock first, based on when it arrived. FEFO issues the stock that expires first, based on its expiry date. For products without expiry, FIFO is enough. For food, medicines, cosmetics and chemicals, FEFO is safer because a newer batch can sometimes carry an earlier expiry date than older stock.
How often should a small business count inventory?
Rather than one annual stocktake, use cycle counts: count high-value A items monthly or weekly, B items quarterly and C items once or twice a year. Counting a few items often catches errors while the cause is still fresh, and it avoids closing the business for a full count.
When should I switch from Excel to inventory software?
Switch when several people need to update stock, when you add a second location, when you need batch or expiry tracking, or when reconciling billing with stock takes hours each week. If nobody trusts the stock figures in your spreadsheet, that alone is a strong sign it is time to move.
What is a good inventory turnover ratio?
It depends heavily on the industry. Grocery and fresh food turn over quickly, while hardware, jewellery or spare parts turn over much more slowly. Calculate turnover as cost of goods sold divided by average inventory, then compare it with your own past performance and similar businesses rather than a single universal benchmark.